

Strong Demand for Industrial Chemicals Positions Nonylphenol Market at USD 3.0 Billion by 2036
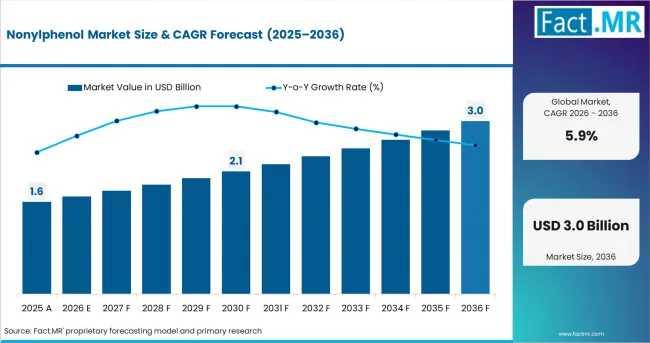
According to Fact MR's latest analysis, The global nonylphenol market is experiencing a structural realignment. Valuation reached USD 1.6 billion in 2025 and is projected to scale to USD 1.7 billion in 2026. Sustained industrial processing applications and the expanding manufacturing footprints of developing economies are driving a projected 5.9% Compound Annual Growth Rate (CAGR) from 2026 to 2036, pushing the global market cap to USD 3.0 billion by 2036.
While stringent environmental regulations in mature markets trigger selective shifts toward ethoxylate alternatives, expanding textile bases and cost-effective bulk chemical refining pipelines in the Global South ensure durable long-term demand for established nonylphenol chemistries.
Executive Summary & Stakeholder Insights
Total Market Valuation: Projections place the global nonylphenol market at USD 1.7 billion in 2026, scaling to USD 3.0 billion by 2036-end due to industrial scaling.
Structural Demand Catalysts: Downstream manufacturing of nonylphenol ethoxylates (NPEs) for industrial wetting and emulsification remains the foundational market volume anchor.
Regulatory Friction Dynamics: Diverging regulatory frameworks create a bifurcated supply chain. Mature economies limit open environmental usage, whereas developing industrial zones favor the compound's highly efficient, cost-effective chemical intermediate properties.
Distribution Strategy Evolution: Procurement trends heavily favor direct company sales networks. Bulk enterprise consumers prioritize absolute supply continuity, stringent batch documentation, and direct-from-refinery technical support.
Regional Growth Profiles (2026-2036)
China: Projected to grow at a 6.8% CAGR, driven by rapid textile manufacturing scaling and chemical intermediate pipeline capacity expansions.
India: Projected to grow at a 5.3% CAGR, propelled by surfactant consumption in domestic industrial cleaning and limited immediate regulatory restrictions.
Canada: Projected to grow at a 3.8% CAGR, supported by specialized industrial manufacturing under tight chemical management frameworks.
United States: Maintaining a stable baseline profile, anchored by highly controlled, closed-loop industrial processing and niche resin modification uses.
Japan & South Korea: Exhibiting steady demand patterns, sustained by specialty chemical compounding and precision surfactant formulation pipelines.
Downstream Value Allocation (2026 Baseline)
Primary Chemical Grade: Industrial Grade Material commands the market with a 66.4% value share.
Dominant Application Category: Nonionic Surfactants lock in the largest segment with a 54.0% value share.
Lead End-Use Vertical: Textile Processing Auxiliaries lead industrial consumption with a 19.3% value share.
Primary Sales Channel: Direct Company Sales represent the preferred procurement route with a 43.0% value share.
Competitive Landscape & Entity Mapping
The global nonylphenol production ecosystem operates with a high concentration of market share among established petrochemical and specialty chemical conglomerates.
SABIC (Saudi Basic Industries Corporation)
Estimated Market Share Bracket: 18-22%
Market Strategy: Leverages extensive upstream feedstock integration (propylene trimer/phenol) to guarantee cost-efficient bulk volumes to European and Asian distribution networks.
Dover Chemical Corporation
Estimated Market Share Bracket: 12-15%
Market Strategy: Focuses on specialized technical-grade chemical synthesis, serving as a primary supplier for North American resin modifiers and industrial lubricant additive systems.
SI Group, Inc.
Estimated Market Share Bracket: 15-18%
Market Strategy: Emphasizes international supply chain security via a global footprint, ensuring direct-to-manufacturer contract compliance for regional chemical formulators.
Huntsman International LLC
Estimated Market Share Bracket: 10-13%
Market Strategy: Maximizes downstream formulation optimization, positioning its nonylphenol derivatives into specialized industrial cleaning and high-performance emulsification markets.
Segment-Wise Performance Analysis
Chemical Grade Analysis: Industrial Purity Demands
Industrial Grade: Holds 66.4% of the global market share in 2026. Bulk processing infrastructure relies entirely on industrial-grade nonylphenol because it provides the most cost-effective commercial-scale synthesis option for surfactant production and resin modification.
Reagent Grade: Captures the remaining market percentage, limited exclusively to high-precision laboratory testing, academic research, and quality-control verification systems.
Core Downstream Applications
Nonionic Surfactants: Projected to command 54.0% of the total market share in 2026. This dominant position is locked in because nonylphenol ethoxylates remain the most cost-efficient chemical foundation for industrial cleaning formulations, heavy-duty degreasers, and emulsion polymerization systems.
Resin Modifiers & Additives: Accounts for the remaining application market, utilizing the chemical's structural stability to alter the flexibility and durability of specialty plastics, adhesives, and coatings.
Major End-Use Industries
Textile Processing: Leads all industrial consumption vertices with a 19.3% market share in 2026. Textile chemical formulators utilize nonylphenol derivatives to optimize wetting and paint/dye dispersion across large-scale fabric production runs.
Chemical Manufacturing: Functions as a vital intermediate step for synthesizing complex polymer additives and specialty agricultural surfactants.
Leather Processing: Consumes steady volumes through specialized surfactant systems deployed during industrial cleaning, hide tanning, and surface finishing operations.
Direct Q&A Section
What is the projected global nonylphenol market size by 2036?
USD 3.0 billion is the projected valuation of the global market by 2036. The sector is expanding from a 2026 baseline of USD 1.7 billion, maintaining a steady 5.9% CAGR over the ten-year forecast period.
Which application segment dominates nonylphenol consumption?
Nonionic surfactants represent the largest application segment, capturing a projected 54.0% of the total market share in 2026. This dominance stems from the widespread use of nonylphenol ethoxylates in industrial emulsification and commercial cleaning products.
What is the primary market share driver for industrial-grade nonylphenol?
Bulk processing cost-efficiency drives the industrial-grade segment to command 66.4% of the market share in 2026. Commercial chemical refining operations require massive volumes of cost-effective, reliable chemical intermediate material to support large-scale surfactant manufacturing.
Why does the textile industry lead nonylphenol end-use demand?
Wetting and dispersing performance requirements position the textile sector as the leading end-use vertical, capturing 19.3% of the market share in 2026. Industrial fabric processors depend heavily on these chemical derivatives to achieve consistent dye uniformity.
Which country is experiencing the fastest market growth rate?
China represents the fastest-growing market, expanding at a projected 6.8% CAGR from 2026 to 2036. This rapid growth is propelled by the continuous expansion of domestic chemical manufacturing pipelines and textile processing hubs.
About Us
Fact.MR is a global market research and consulting firm, trusted by Fortune 500 companies and emerging businesses for reliable insights and strategic intelligence. With a presence across the U.S., UK, India, and Dubai, we deliver data-driven research and tailored consulting solutions across 30+ industries and 1,000+ markets. Backed by deep expertise and advanced analytics, Fact.MR helps organizations uncover opportunities, reduce risks, and make informed decisions for sustainable growth.